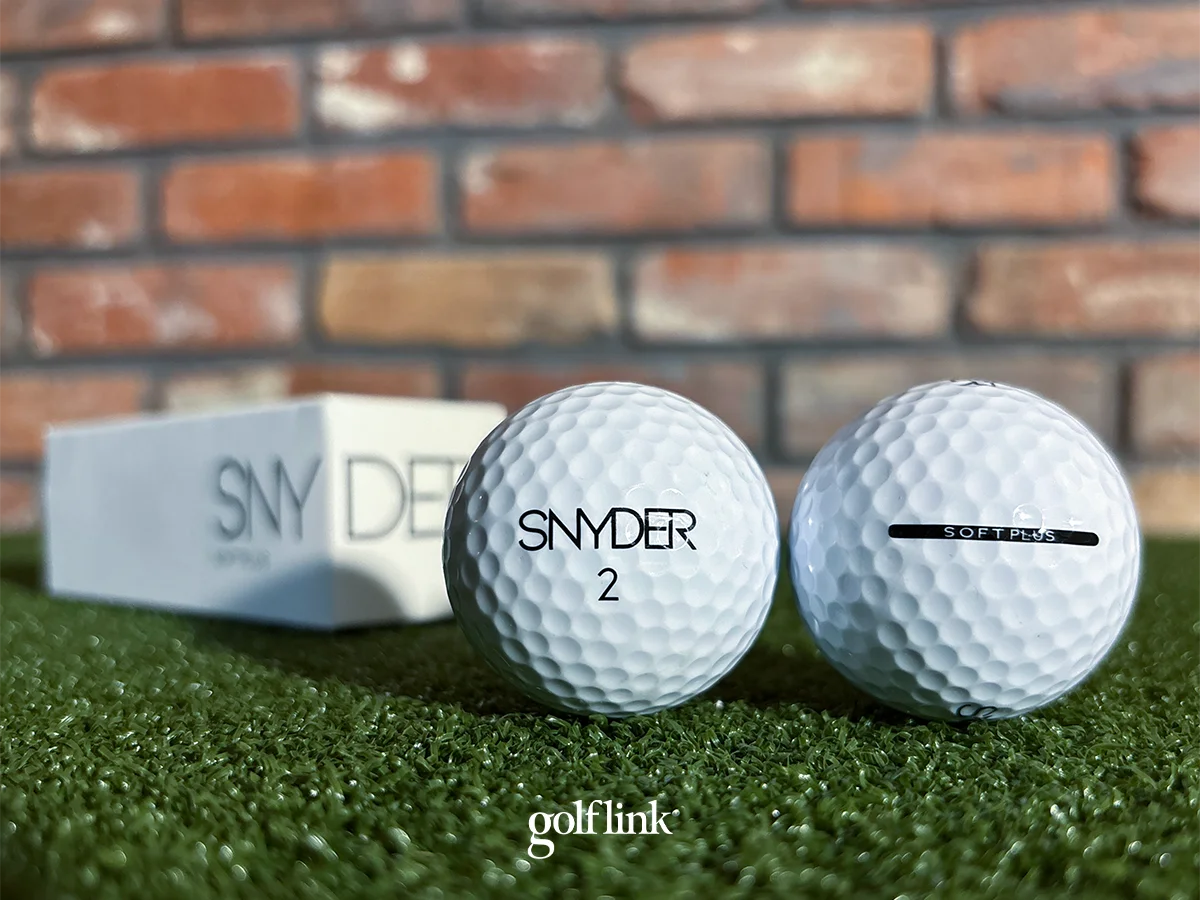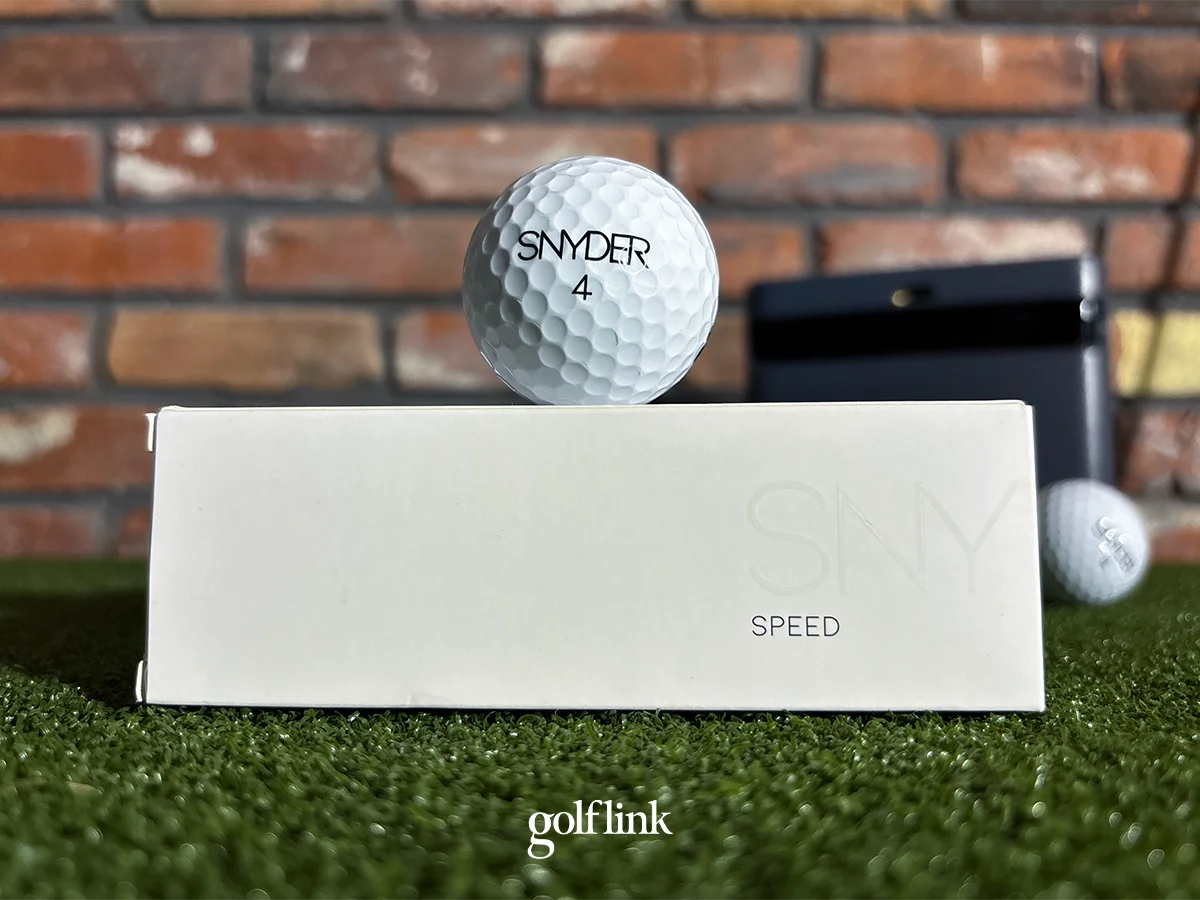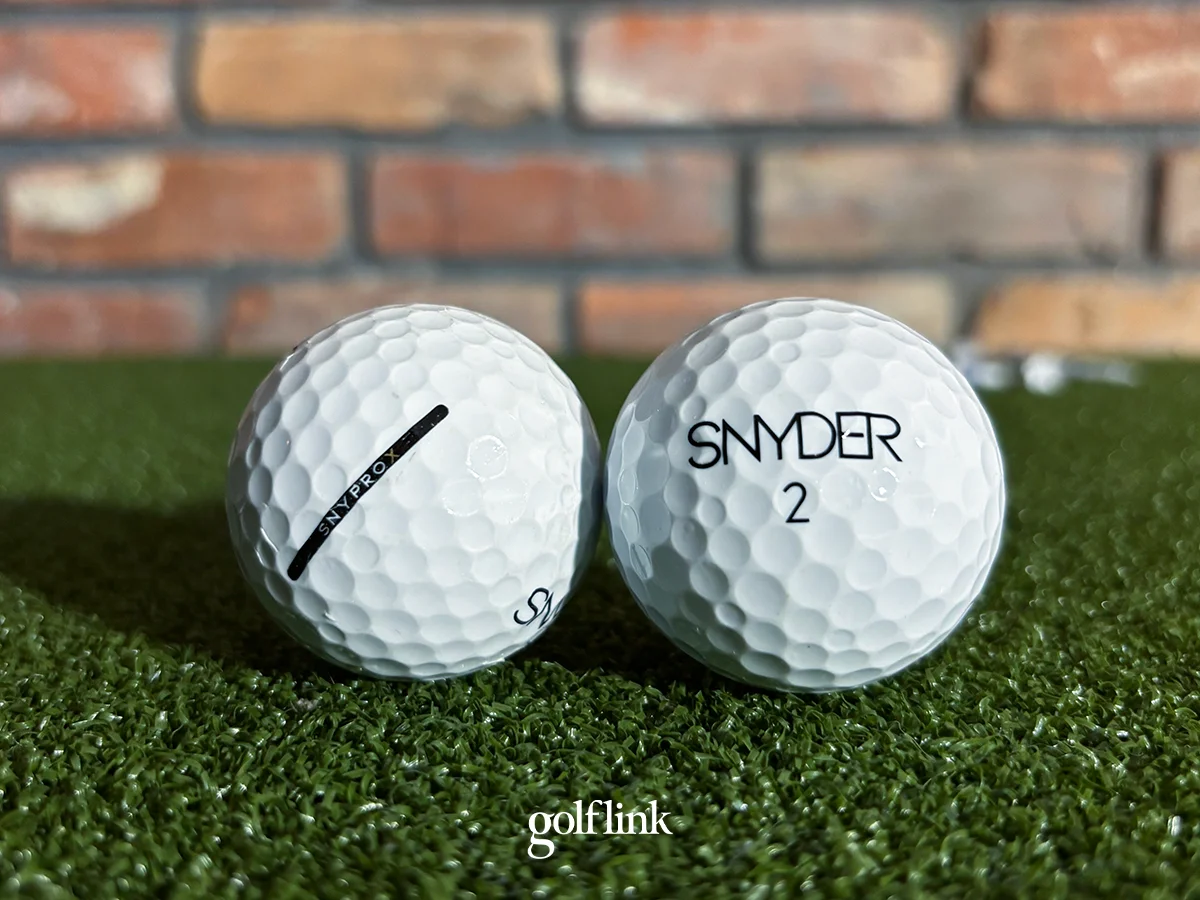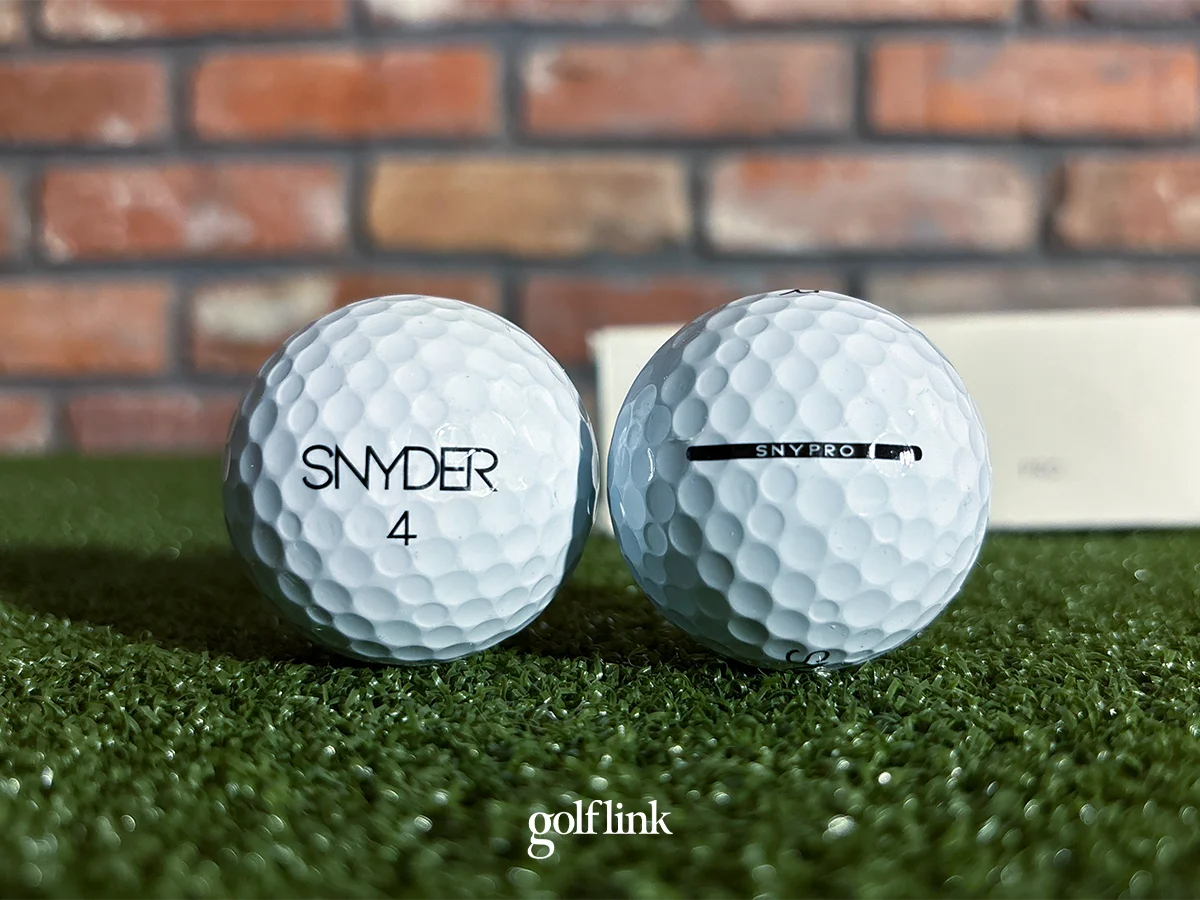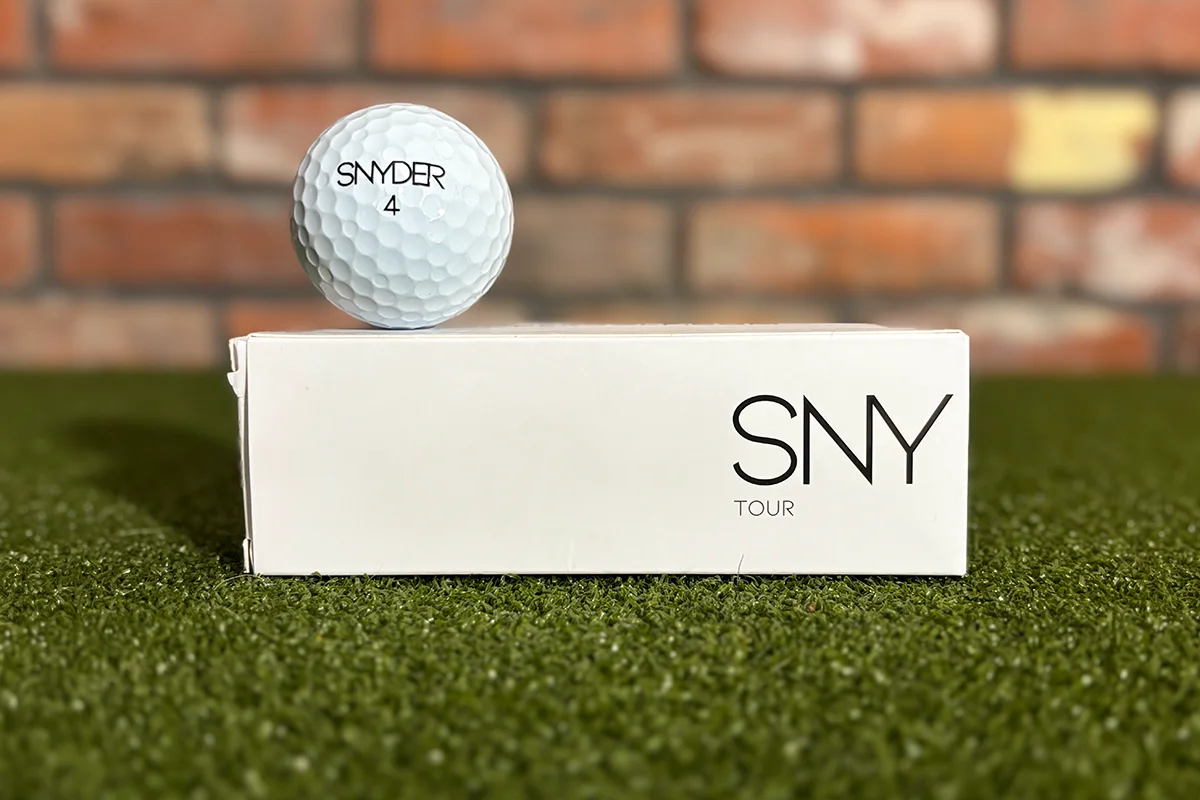

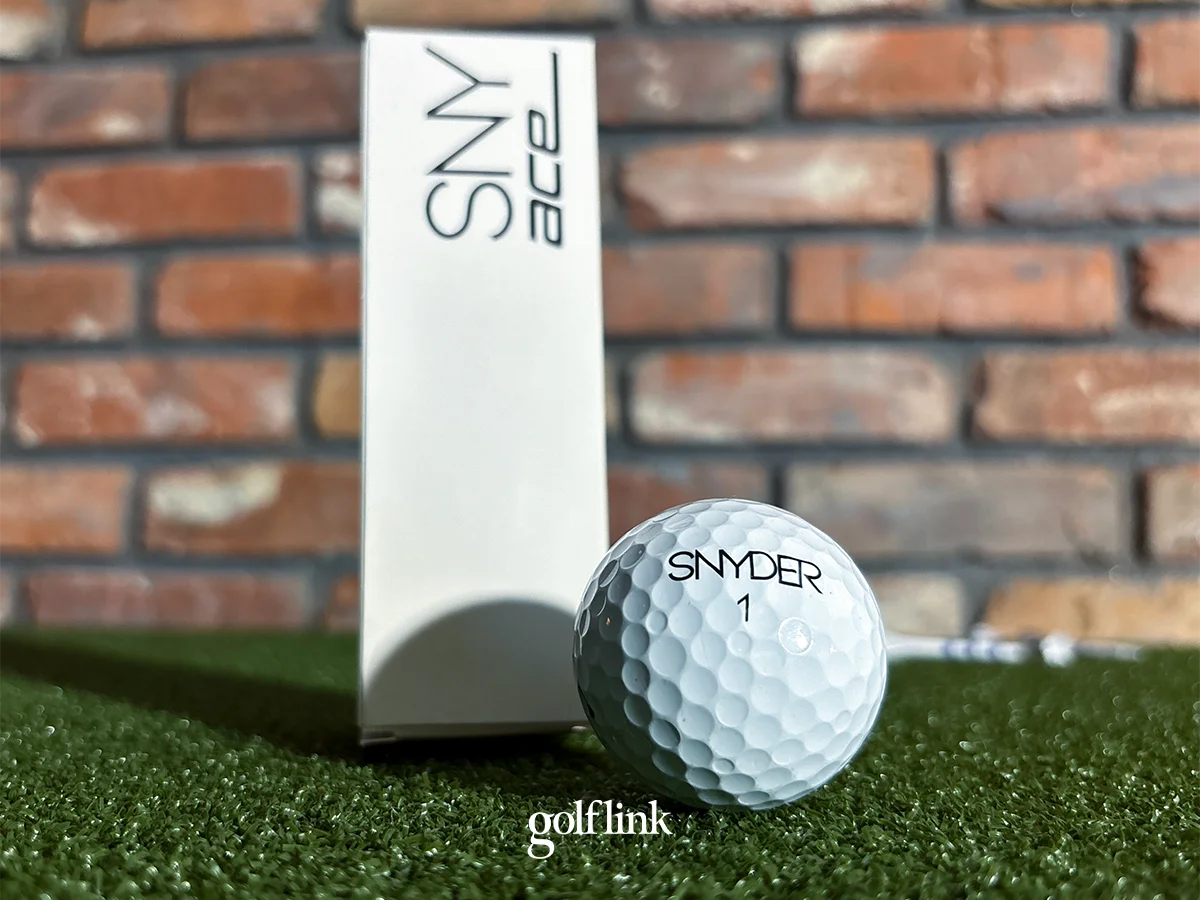
We tested the Snyder Ace golf ball using our standardized golf ball testing protocol. Here are the average launch monitor results from our test.
All testing was conducted using our published golf ball testing methodology and reflects controlled human testing.
Test Setup Overview
- Launch Monitor: SkyTrak ST Max
- Ball Tested: Snyder Ace
- Testing Method: Human testing within defined swing speed and impact bands
- Shots Recorded: 12 qualifying shots per club (best 8 used for averages)
- Environment: Indoor
Learn more about How We Test Golf Balls and see the list of every golf ball we’ve tested.
Driver Results
| Ball Speed (MPH) | 138.0 |
| Launch Angle (Deg.) | 13.4 |
| Backspin (RPM) | 2515 |
| Apex (Yds) | 21.9 |
| Carry Distance (Yds) | 221.7 |
| Total Distance (Yds) | 243.6 |
| Offline (Yds) | 7.3 |
| Sidespin (RPM) | 263.0 |
7-Iron Results
| Ball Speed (MPH) | 111.0 |
| Launch Angle (Deg.) | 19.0 |
| Backspin (RPM) | 4101 |
| Apex (Yds) | 23.6 |
| Descent Angle (Deg.) | 40.8 |
| Carry (Yds) | 162.5 |
| Roll Out (Yds) | 11.1 |
| Total Distance (Yds) | 173.6 |
| Offline (Yds) | 12.0 |
| Sidespin (RPM) | 166.0 |
50-Yard Wedge Results
| Launch Angle (Deg.) | 30.3 |
| Backspin (RPM) | 7068 |
| Apex (Yds) | 9.4 |
| Carry Distance (Yds) | 51.0 |
| Roll Out (Yds) | 2.4 |
| Total Distance (Yds) | 53.5 |
Snyder Ace Performance Notes
Snyder Ace is a sneaky-long ball for its price point. Its distance score ranks in the top quarter of the 43 balls we tested, with driver carry averaging 221.7 yards and total distance of 243.6. Wedge control also grades well, landing in the top third of the field.
Accuracy is where Ace gives some of that back. It finished near the bottom of our 43-ball accuracy rankings. Still, at $33 a dozen with above-average distance and short-game control, it's one of the better value scores in the test.
Testing Methodology & Disclaimer
These results reflect controlled human testing within strict swing speed and impact quality bands. Individual results will vary. Small numerical differences in data may not translate into noticeable performance differences on the course.